Reading time: 9 minutes
Published: December 27, 2024
Modified: January 11, 2025
In recent years, the S&P 500 ↗ has been significantly influenced by a select group of technology giants, often referred to as the Magnificent Seven Stocks (a reference to a movie released in 1960 starring Steve McQueen):
- Alphabet (GOOGL)
- Amazon (AMZN)
- Apple (AAPL)
- Meta Platforms (META)
- Microsoft (MSFT)
- NVIDIA (NVDA)
- Tesla (TSLA)
These companies have driven a substantial portion of the index’s performance, raising questions about market concentration and future returns.
This blog explores the dominance of these seven tech companies within the S&P 500. It analyzes the index’s returns with and without their influence. It also examines historical market trends and the potential for mean reversion. Additionally, the blog discusses the impact of unforeseen black swan events and suggests investment strategies to mitigate associated risks.

Key Takeaways
- The Magnificent Seven stocks heavily influence S&P 500 returns, creating both opportunities and risks for investors relying on the index for diversification.
- Market trends, such as mean reversion and black swan events, could significantly impact the performance of these tech giants and, consequently, the broader market.
- Diversification and risk management strategies are essential to mitigate potential losses and capitalize on the growth driven by these dominant companies.
Dominance of the Magnificent Seven Stocks
As of the end of 2024, these seven tech behemoths constitute approximately 31% of the S&P 500’s market capitalization. Their substantial growth, fueled by advancements in artificial intelligence and other technologies, has propelled the index to new heights. However, this concentration means that the S&P 500’s performance is heavily reliant on a handful of companies, potentially increasing volatility and investment risk.
The S&P 500 is a market-capitalization-weighted index, where each company’s influence on the index’s performance is proportional to its market capitalization—that is, the total market value of its outstanding shares. In such an index, companies with larger market caps have a greater impact on the index’s movements, while smaller companies have less influence.
Over the past five years, the market cap of the Magnificent Seven has grown significantly. In 2019, these stocks represented approximately 20-25% of the S&P 500; toward the end of 2024, their share has risen to around 31%.
Investing in an S&P 500 index fund offers exposure to a diversified basket of 500 companies across various industries, weighted by market capitalization. This approach generally protects investors from poor performance in a subset of stocks. However, the increasing dominance of the Magnificent Seven has led to a situation where their performance disproportionately influences the entire index. Some have even coined the term The Mediocre 493 to describe the remaining stocks.
S&P 500 Returns: With and Without the Magnificent Seven Stocks
The impressive returns of the S&P 500 in recent years can be largely attributed to the Magnificent Seven stocks, which have played an outsized role in the S&P 500’s performance recently. Here’s a breakdown of the approximate compound annual growth rate (CAGR) over the last 5 years (from the beginning of 2020 toward the end of 2024):
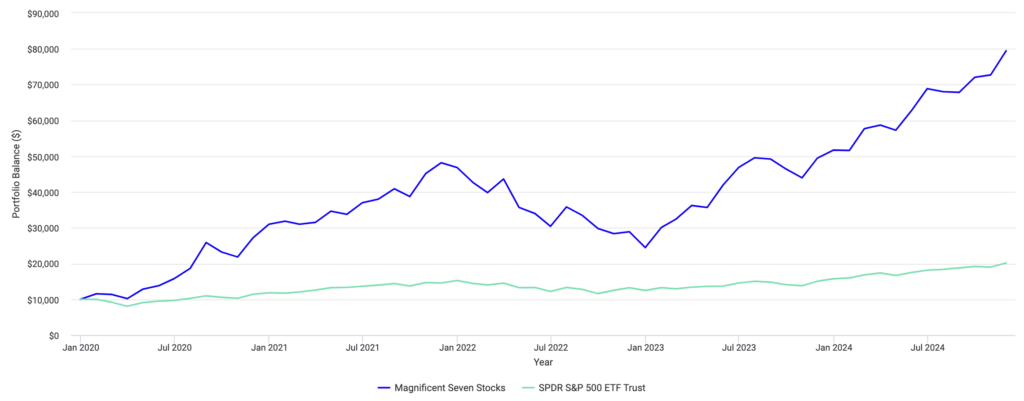
- S&P 500: Approximately 15.3% CAGR. A $10,000 investment at the beginning of 2020 would appreciate to $20,138 at the end of 2024.
- Magnificent Seven: Approximately 52.4% CAGR. A $10,000 investment would have appreciated to $79,441.
- “S&P 493”: Calculating this CAGR precisely requires detailed historical data on the individual weights and performances of all 500 constituent stocks over the past five years. Assuming the combined weight of the Magnificent Seven was between 20% to 25% in 2020, the remaining 493 stocks would represent 75% to 80% of the index. Based on these assumptions, the estimated CAGR for the remaining 493 stocks over the last five years is approximately 3% to 6%! This performance is both surprising and disappointing, highlighting just how much the broader market has struggled compared to the Magnificent Seven.
For a detailed comparison between the S&P 500 and the Magnificent Seven, I recommend exploring the backtest I conducted using Portfolio Visualizer ↗, one of my preferred analytical tools. The graph below, which was taken from this tool, clearly shows the superior performance of the Magnificent Seven versus the S&P 500 (remember, the S&P 500 includes the Magnificent Seven!).

© 2024 SRL Global
Value Comparison
As of mid-October 2024, the valuation disparity between the Magnificent Seven and the other 493 stocks is notable:
- Magnificent Seven: The average price-to-earnings (P/E) ratio is around 45, indicating higher valuations.
- “S&P 493”: The average P/E ratio is approximately 19, suggesting more attractive valuations.
This significant difference implies that the “S&P 493” may have greater potential for appreciation, especially if the economy experiences a soft landing.
Key Observations from This Analysis
- The S&P 500 Performance: A 15.3% CAGR exceeds the historical average return of about 10%-11% since the 1950s.
- Concentration of Gains: The analysis highlights the significant concentration of market gains in a small number of stocks, a trend investors should be aware of.
- The “S&P 493” Performance: A CAGR between 3% and 6% suggests potential undervaluation in these stocks, which may appreciate in the coming years.
Historical Returns and Mean Reversion
As previously noted, the S&P 500 has delivered an average annual return of approximately 10%-11%. However, the recent years’ higher returns have raised concerns about sustainability. The concept of mean reversion suggests that periods of above-average performance are often followed by below-average returns. This indicates that the market may adjust to align with historical norms over time.
For investors, this could mean tempering expectations for future gains, particularly if the Magnificent Seven stocks cease to outperform or encounter setbacks. Staying mindful of historical trends can help balance optimism with caution.
Impact of Black Swan Events
The S&P 500 has endured several black swan events—rare and unpredictable occurrences with severe market consequences—including the dot-com bubble (2000), the financial crisis (2008), and the COVID-19 pandemic (2020). Each event caused sharp market declines but demonstrated the market’s long-term resilience:
Dot-com Bubble (2000-2002)
- Peak-to-trough decline: ~49%
- Recovery time: ~7 years (peaked March 2000, bottomed October 2002, recovered by 2007).
Financial Crisis (2008-2009)
- Peak-to-trough decline: ~57%
- Recovery time: ~6 years (peaked October 2007, bottomed March 2009, recovered by 2013)
COVID-19 Pandemic (2020)
- Peak-to-trough decline: ~34%
- Recovery time: ~5.5 months (peaked February 2020, bottomed March 2020, recovered August 2020)
Key Takeaways from Black Swan Events
- Severity and Recovery Times Vary: The financial crisis had the most severe decline, while the COVID-19 recovery was remarkably fast due to swift government intervention.
- Market Resilience: Despite downturns, the S&P 500 historically recovers and trends upward over the long term.
- Sequence of Returns Risk: Retiring during a major downturn can significantly impact long-term portfolio sustainability. Diversification and contingency planning are critical for retirees. Implementing strategies such as maintaining a cash buffer and adopting flexible withdrawal plans can help mitigate this risk.
Hedging Strategies
Given market concentration, mean reversion risks, and black swan events, investors may consider hedging strategies to mitigate risk. Strategies range from conservative to aggressive, tailored to individual risk tolerance. These strategies are high-level summaries in the context of this particular blog and are not meant to be comprehensive guides.
As with the classic tortoise and hare fable, slow and steady strategies often prevail in uncertain markets. For more on this concept, check out our blog, Investing Like a Tortoise or Hare: Which Wins Over Time?.
Very Conservative Investors
For risk-averse investors seeking stability, high-yield savings accounts, certificates of deposit (CDs), and Treasury bills/notes offer secure returns without market exposure. In this case, be aware that staying ahead of inflation is challenging to do without a slightly more aggressive approach to investing.
Conservative Investors
Buffered ETFs provide exposure to equity gains with downside protection, making them suitable for those seeking moderate risk. Learn more in our blog about Buffered ETFs.
Moderate Investors
Dollar-cost averaging into the S&P 500 is a proven method for mitigating timing risk, especially for younger investors who have time on their side. Equal-weighted ETFs, such as the Invesco S&P 500 Equal Weight ETF (RSP), provide diversification by reducing reliance on top-performing stocks.
Aggressive Investors
Fans of the Magnificent Seven may consider the MAGS ETF, which focuses exclusively on these mega-cap tech stocks. Read more about MAGS ETF ↗.
Very Aggressive Investors
For investors seeking a more aggressive approach, focusing solely on the top three performers among the Magnificent Seven—Nvidia, Microsoft, and Apple—may offer higher growth potential, albeit with increased risk. According to The Motley Fool ↗, these three stocks have outperformed the S&P 500’s total return since the beginning of 2022.
Conclusion: Dominance of the Magnificent Seven Stocks
The dominance of the Magnificent Seven in the S&P 500 presents both opportunities and challenges. While their outsized performance has driven recent gains, it also raises concerns about market vulnerability and future returns. Investors should consider diversification strategies, remain vigilant, and explore tools such as buffered ETFs to safeguard against downturns and maintain alignment with long-term financial goals.
And remember, it’s always a great idea to chat with your financial or tax advisor to make sure your decisions are right on track and aligned with the latest guidelines and laws.